
The fire dataset utilized in this application derives from imagery and has been generalized to provide statistics for areas of approximately 15000 square km. The height and width of a 3D cone symbol indicates the frequency of fires per approximately 15000 square km, and the fire intensity (FRP – Fire Radiative Power) is depicted in yellow to orange, with orange indicating higher values for the mean FRP in that area.
Make sure to hover over the cones on the globe to read more about those areas, and pause the time whenever necessary using the pause button.
2023 ACTIVE FIRES
Data attribution: Fires - MODIS Collection 6.1, MCD14ML, NASA, https://firms.modaps.eosdis.nasa.gov/download/


ACTIVE FIRES IN 2023
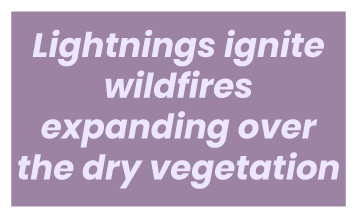
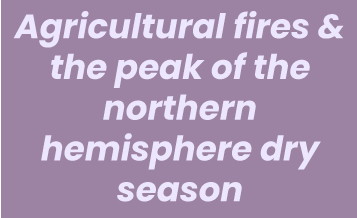
The peaks in the line graphs for fire seasons are consistent each year, mainly due to natural factors leading to active fires throughout a year.
Although Africa has the largest burnt area, Australia experiences the most intense fires.


The above graphs were based on non-generalized 2023 data from the MCD14ML dataset , available for download from earthdata.nasa.gov.
*This calculation is based on the original dataset, which contained points extracted from a raster with a resolution of 1 km. This means that for each square kilometer of the continent, the presence of one or more fires was recorded and used to determine the percentage of the total area affected by fires.
